Average Calculator
Free Average Calculator: enter any list of numbers to instantly compute the arithmetic mean, median, mode, geometric mean, harmonic mean, standard...
Formula used
How to use this Average Calculator
Enter realistic values, then review KPIs and charts to support your decision.
- Input: Type or paste your numbers in the large text area.
- Calculate: The Dashboard automatically updates. Click "Calculate" to manually force validation.
- KPI Analysis:
- Average (Mean): The mathematical center of your dataset.
- Median: The middle value when all numbers are sorted. Great for filtering out extreme outliers.
- Range: The difference between the highest and lowest numbers.
- Min / Max: The smallest and largest values in your set.
The Ultimate Guide to Understanding Averages
Whether you are analyzing corporate financial growth, evaluating classroom test scores, or processing vast sets of scientific data, calculating the "average" is the foundation of statistical analysis. While most people instinctively think of the arithmetic mean when utilizing an Average Calculator, the realm of data science requires a far more nuanced approach.
What is the Arithmetic Mean?
The arithmetic mean represents the mathematical center of a dataset. It is universally applied to evenly distributed numerical sets where no single variable vastly outweighs the others. To calculate the mean manually, all numerical values are summed together and subsequently divided by the total count of instances.
Arithmetic Mean Formula:
Where x̄ is the mean, ∑x is the sum of all values, and n is the number of values.
Mean vs. Median: Avoiding Data Distortion
A critical mistake made by inexperienced analysts is relying solely on the mathematical mean. The arithmetic average is exceptionally vulnerable to outliers. For instance, if you track the salaries of 10 school teachers and one billionaire, the "average" salary will mathematically suggest everyone is highly wealthy.
The Power of the Median
This is why professional datasets use the Median. The median is the literal midpoint of your sorted data. If there are massive outliers sitting at the outer edges, the median remains entirely unaffected. By using a professional Average Calculator, you should immediately compare the Mean and Median. A large discrepancy is a red flag indicating heavily skewed data.
Advanced Metrics: Moving Beyond the Basic Average
When you are assessing compound interest, population statistics, or inflation rates, the arithmetic mean will output inherently flawed data. In these specific mathematical disciplines, experts rely on specialized metrics.
Geometric Mean
The Geometric Mean focuses on proportional growth rather than absolute addition. It is calculated by multiplying all values together, and then taking the nth root (where n is the total number of values). It ensures that a +50% gain followed by a -50% loss correctly reflects a net negative outcome.
Frequently Asked Questions
Is negative data calculated the same way?
Absolutely. The mathematical principle remains constant. Negative numbers will simply offset the positive values during the summation phase before being divided by the total unit count.
Why is my average a decimal when my inputs are whole numbers?
This is standard behavior in algebra. Unless a dataset is perfectly divisible by its own count, it will generate fractions or decimals. This precision (e.g., an average test score of 87.4) provides far more insight than a rounded whole number.
When should I compute a Weighted Average?
A weighted average is fundamentally required when elements carry uneven importance. It is heavily utilized in academic grading (where exams carry a 70% weight vs. 30% for homework) or portfolio return analysis based on capital allocation.
Related Calculators & Analytical Tools
Explore our professional suite of analytical tools to process your findings further:
- Percentage Calculator →
Evaluate exact percentage changes, margins, and ratios.
- Investment Calculator →
A vital next step after calculating compound geometric growth.
- Random Number Generator →
Generate statistical controls to test against your data averages.
How to Use the Average Calculator
Enter your numbers in the input area — separated by commas, spaces, semicolons, or line breaks. The calculator parses the list automatically and updates all statistics in real time as you type. No "Calculate" button press is required. Use the quick presets to load example data sets instantly.
Supported Input Formats
- Comma-separated: 10, 20, 30, 40, 50
- Space-separated: 10 20 30 40 50
- One per line: each number on its own line
- Mixed: 10, 20 30; 40 — the parser handles any combination
- Decimals and negatives: −5.5, 0, 3.14, 1000000
What Is an Average? Types Explained
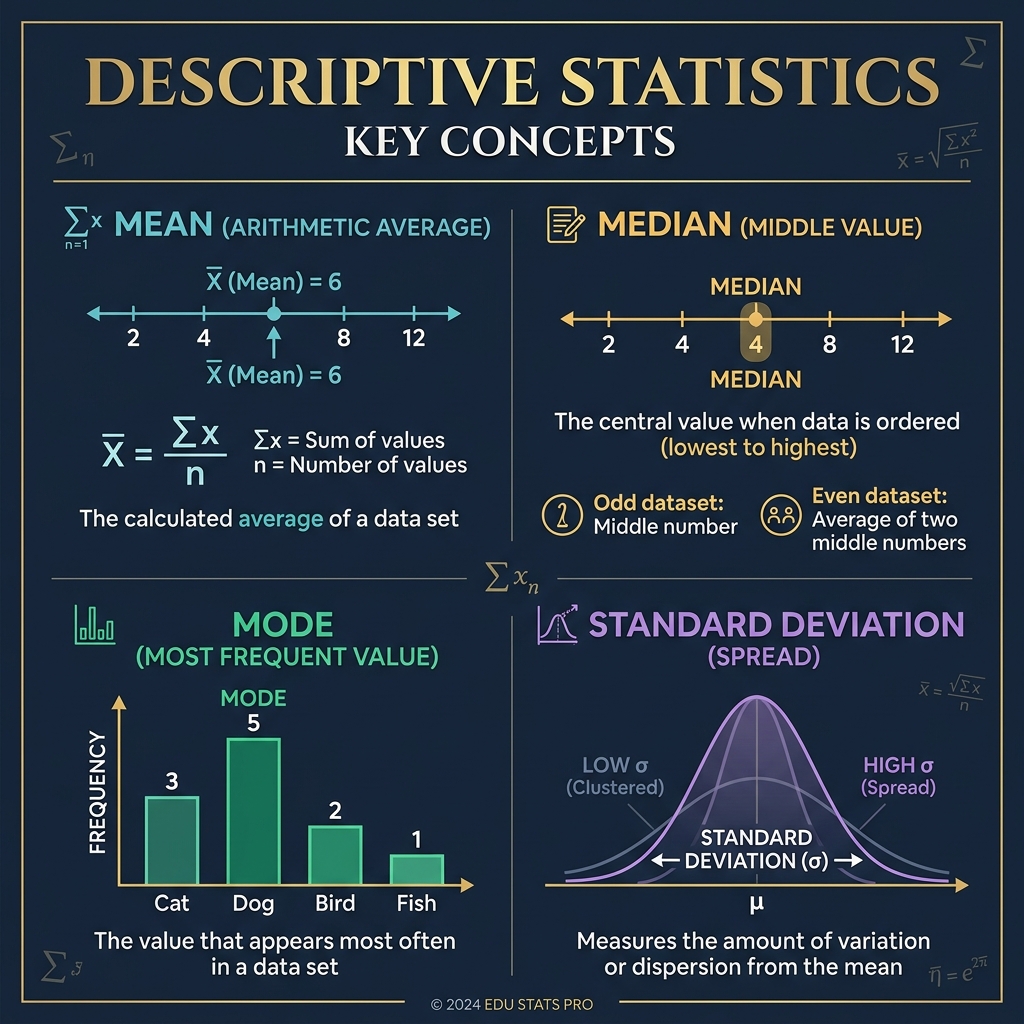
The word "average" can mean different things in different contexts. This calculator computes all major types:
1. Arithmetic Mean (The "Normal" Average)
The arithmetic mean is what most people mean by "average": add all values together and divide by the count. Formula: x̄ = Σxᵢ / n. It is the most commonly used measure of central tendency and the basis for many statistical methods. However, the mean is sensitive to outliers — a few very large or very small values can skew it significantly.
2. Median (The Middle Value)
Sort all values from smallest to largest. If the count is odd, the median is the middle value. If even, it is the average of the two middle values. The median is resistant to outliers and is the preferred measure when data is skewed — for example, median household income is a better representation than mean income because a few billionaires would inflate the mean dramatically.
3. Mode (The Most Frequent Value)
The mode is the value (or values) that appear most frequently in the dataset. A dataset can be unimodal (one mode), bimodal (two), or multimodal (many). It is the only average that works for categorical (non-numeric) data. If no value repeats, the dataset has no mode.
4. Geometric Mean
The geometric mean is the nth root of the product of all n values: GM = (x₁ × x₂ × … × xₙ)^(1/n). It is used when values are multiplicative or span several orders of magnitude — compound investment returns, population growth rates, pH values, and ratios. All values must be positive for the geometric mean to be defined.
5. Harmonic Mean
The harmonic mean is the reciprocal of the arithmetic mean of the reciprocals: HM = n / (1/x₁ + 1/x₂ + … + 1/xₙ). It is used for rates and speeds — if you drive 60 mph one way and 40 mph back, your average speed is the harmonic mean (48 mph), not the arithmetic mean (50 mph). Appropriate when averaging rates, prices-per-unit, or any ratio where the denominator is constant.
6. Weighted Average
A weighted average assigns different importance (weight) to each value. For example, course grades where tests count 60% and homework 40%: x̄w = Σ(wᵢ × xᵢ) / Σwᵢ. The weighted average calculator on this page lets you enter values and weights separately.
Understanding Standard Deviation & Variance
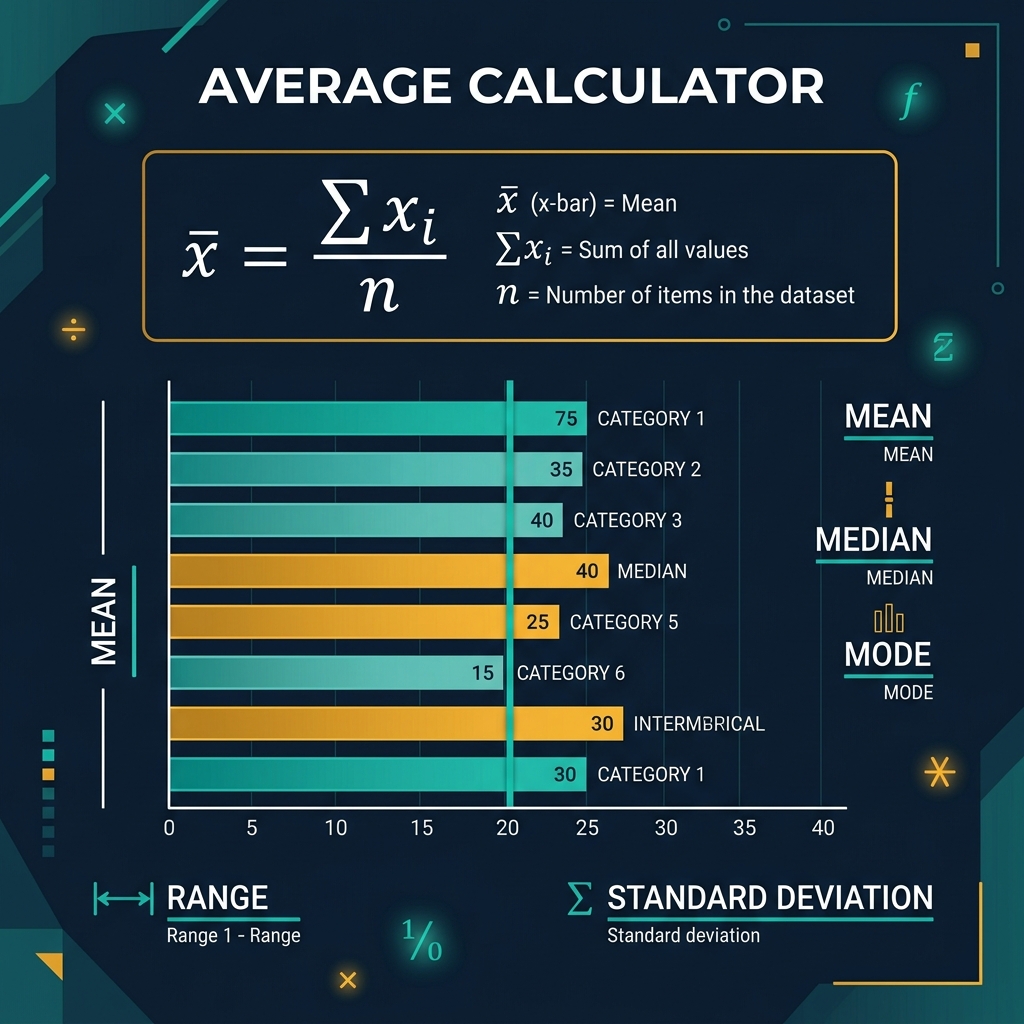
Standard deviation and variance measure the spread of your data — how far values typically deviate from the mean:
- Variance (σ²): The average of the squared differences from the mean. Calculated as: σ² = Σ(xᵢ − x̄)² / n for population, or / (n−1) for sample.
- Standard Deviation (σ): The square root of the variance. Used far more commonly because it is expressed in the same units as the original data. A small SD means data clusters tightly around the mean; a large SD means it is spread out.
- Population vs. Sample: Use population formulas (divide by n) when you have the entire dataset. Use sample formulas (divide by n−1) when your data is a sample meant to represent a larger population. This correction (Bessel's correction) removes bias.
Real-World Applications of Averages
- Finance: Average return on investment, average monthly expenses, weighted average cost of capital (WACC), moving averages in stock charts.
- Education: GPA calculation uses a weighted average of grades. Class rank uses percentile ranks. Standardized test scores are normalized to a mean of 100 or 500.
- Sports analytics: Batting averages, player efficiency ratings, average points per game. The difference between a good and great player is often fractions of a point in average.
- Medicine and public health: Average blood pressure, average BMI in a population, median survival time in clinical trials. BMI calculations are assessed against population averages.
- Engineering and manufacturing: Quality control uses mean and standard deviation to set tolerances. Six Sigma methodology aims to keep defects within 6 standard deviations of the target.
- Weather and climate: Average temperature, average rainfall, 30-year climate normals are all arithmetic means. "Abnormal" weather is defined by deviations from these averages.
When to Use Mean vs. Median
Choosing between mean and median is one of the most important decisions in descriptive statistics. The key question: is your data skewed by outliers?
- Use the mean when data is roughly symmetric, normally distributed, and free of extreme outliers. Examples: heights of adults, test scores in a large class, manufacturing measurements.
- Use the median when data is skewed or contains outliers. Examples: household income (a few billionaires inflate the mean), house prices, response times (a few very slow responses skew averages), age distributions.
- Report both when in doubt. If mean and median are very different, your data is likely skewed — report both and explain why.
Related Math Calculators
- Percentage Calculator — Averages and percentages work together constantly: average percentage change, class average as a percentage, percent above/below average.
- Slope Calculator — Linear regression uses averages of x and y to compute the best-fit line slope. The slope formula m = Σ(xᵢ − x̄)(yᵢ − ȳ) / Σ(xᵢ − x̄)² relies directly on the means.
- Remainder Calculator — Integer division fundamentals that underpin data bucketing, histogram bin counting, and modular statistical algorithms.