IQ Percentile Calculator
Calculate your IQ percentile instantly using an accurate normal distribution formula. Supports Wechsler (SD=15), Cattell (SD=24), and Stanford-Binet...
Formula used
How to Use the IQ Percentile Calculator
Enter your IQ score from any standardized test, select the scale used by your test, and click Calculate. The calculator instantly converts your score to a percentile using precise normal distribution mathematics — showing exactly what fraction of the population scores at or below your level, your classification category, and your relative rarity (e.g., "1 in 50 people").
Important: Only use scores from professionally administered, standardized IQ tests (WAIS-IV, WISC-V, Stanford-Binet 5, etc.). Online quiz scores are not valid IQ measurements and should not be entered here. This tool performs the same core mathematical conversion used in psychometric reporting — it does not administer a test or diagnose intellectual ability.
Step-by-Step Instructions
- Enter your IQ score — type the full-scale IQ (FSIQ) from your psychometric test report. Use whole numbers.
- Select the test scale — choose the standard deviation used by your test: Wechsler/Stanford-Binet 5 (SD=15, most common), Cattell Culture Fair (SD=24), or Stanford-Binet 4th Edition (SD=16).
- Read your results — you will see your exact percentile, classification label, rarity estimate, z-score, and your position on an interactive bell curve visualization.
- Check the reference table — scroll down to see the full IQ-to-percentile reference table with all major score milestones.
The Mathematics: How IQ Percentile Is Calculated
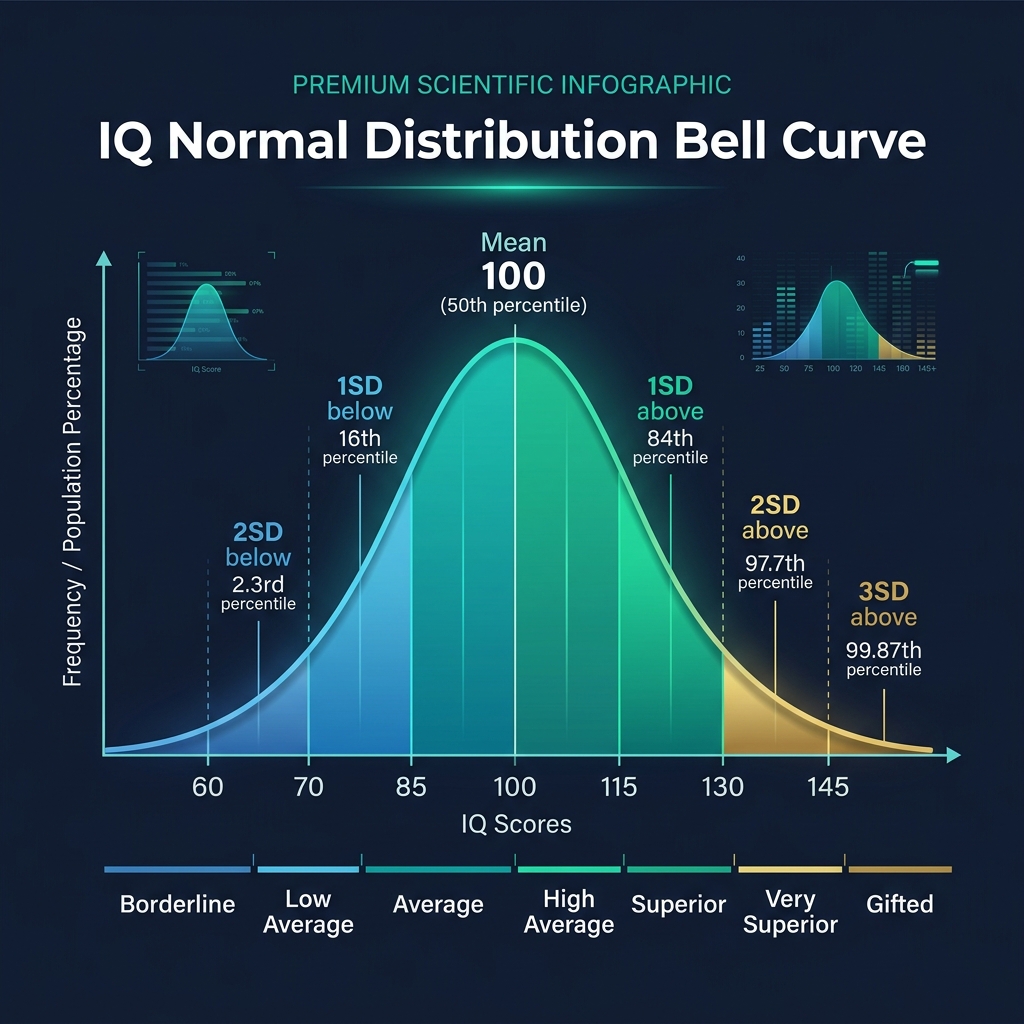
IQ scores are designed to follow a normal (Gaussian) distribution in the general population, with a mean of 100 and a fixed standard deviation (SD). The standard deviation differs by test scale:
- Wechsler scales (WAIS, WISC) and Stanford-Binet 5: SD = 15 (most widely used)
- Cattell Culture Fair Intelligence Test: SD = 24
- Stanford-Binet 4th Edition: SD = 16
The percentile for a score is calculated by first computing the z-score — how many standard deviations the score is from the mean — then applying the cumulative distribution function (CDF) of the normal distribution:
- Z-score formula: z = (IQ − 100) ÷ SD
- Percentile formula: P = Φ(z) × 100%, where Φ is the normal CDF
- Normal CDF: Φ(z) = ½ × [1 + erf(z ÷ √2)]
This calculator uses the Abramowitz & Stegun approximation of the error function (erf), which is accurate to within 1.5 × 10⁻⁷ — far more precise than table-lookup methods used in most IQ percentile charts online.
Example Calculations
- IQ 100 (Wechsler): z = 0, P = 50.00th percentile (by definition)
- IQ 115 (Wechsler): z = +1.0, P = 84.13th percentile (top 15.87%)
- IQ 130 (Wechsler): z = +2.0, P = 97.72th percentile (top 2.28%)
- IQ 145 (Wechsler): z = +3.0, P = 99.87th percentile (top 0.13%, ~1 in 741)
- IQ 132 (Wechsler): Mensa threshold ≈ 98th percentile (top 2%)
IQ Classification Systems
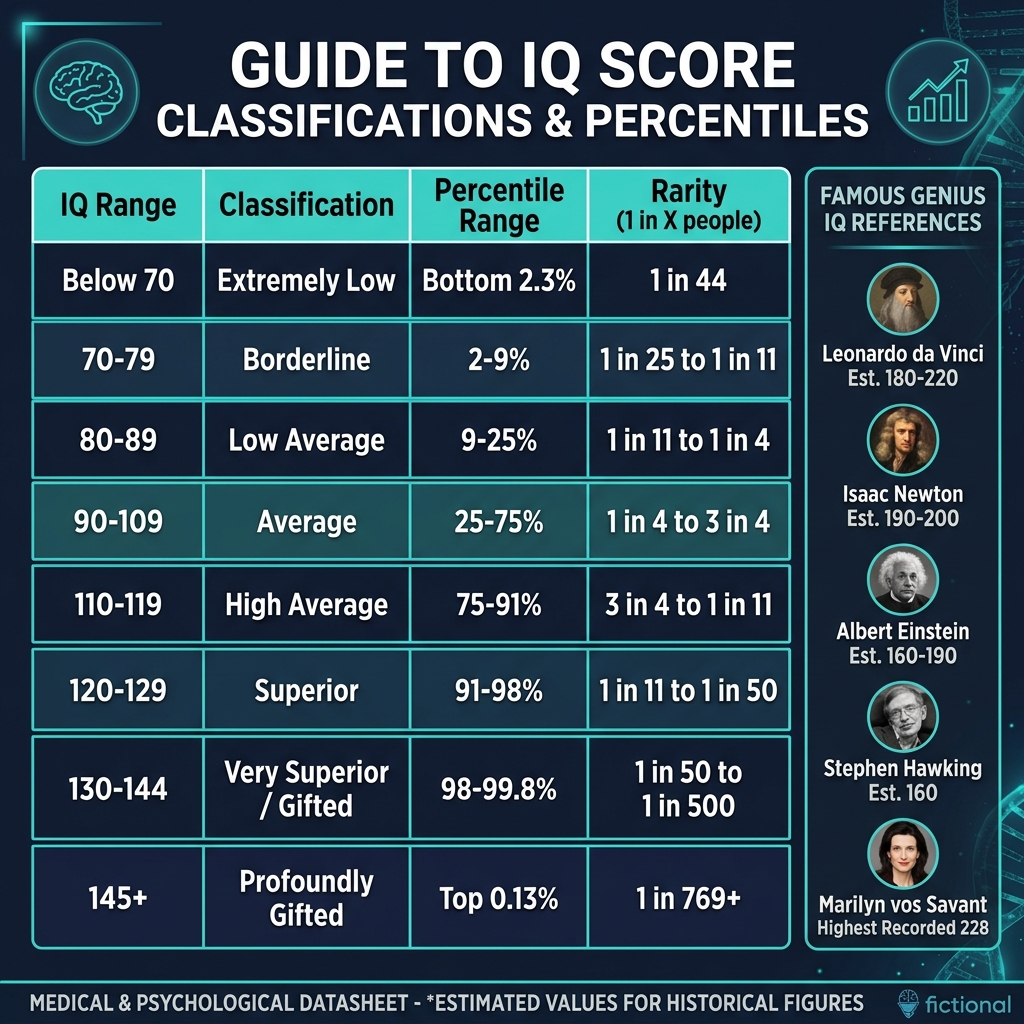
Different organizations use different IQ classification labels. The most widely used system is the Wechsler classification (used in psychological reports in the US, UK, Canada, and Australia):
Wechsler IQ Classification (WAIS-IV / WISC-V)
- 130 and above — Very Superior (Gifted): top 2.3% of the population. Qualifies for Mensa (IQ 132+) and most gifted education programs (IQ 130+). Approximately 1 in 50 people.
- 120–129 — Superior: top 9.2–2.3%, roughly 1 in 12 to 1 in 50 people. Strong academic ability; qualifies for many gifted programs at the district level.
- 110–119 — High Average: top 25–9.2%. Above-average intelligence; typical of many professionals, college graduates, and technical workers.
- 90–109 — Average: middle 50% of the population. The classification system was specifically calibrated so that roughly half the population falls in this range.
- 80–89 — Low Average: bottom 25–9.2%. May experience some academic difficulty but generally can function independently in work and life.
- 70–79 — Borderline: bottom 9.2–2.3%. On the boundary between Low Average and Restricted intelligence.
- 69 and below — Extremely Low / Restricted (Formerly: Intellectual Disability): bottom 2.3%, corresponding to 2+ SD below the mean. Diagnosis of intellectual disability requires both cognitive testing and adaptive behavior deficits.
Other Organizations' Thresholds
Different organizations and publishers use different labels and cutoffs:
- Mensa International: accepts scores in the top 2% — IQ 132+ on Wechsler scales (SD=15) or IQ 148+ on Cattell (SD=24)
- American Psychological Association (APA): uses the Wechsler classification above
- WHO / DSM-5: "Intellectual Disability" defined as IQ below ~70 with associated adaptive behavior deficits (no longer defined by IQ score alone)
- NAGC (National Association for Gifted Children): generally defines "gifted" as IQ 130+ (top 2.3%)
Understanding Different IQ Test Scales
All major IQ tests are normed to a mean of 100 but use different standard deviations, which affects the percentile for the same score:
Wechsler Scales (SD = 15) — Most Common
The Wechsler Adult Intelligence Scale (WAIS-IV) and Wechsler Intelligence Scale for Children (WISC-V) are the most commonly administered individual IQ tests. They measure multiple cognitive domains (Verbal Comprehension, Perceptual Reasoning, Working Memory, Processing Speed) and produce a Full Scale IQ (FSIQ) with SD=15. These are the gold standard for clinical and forensic psychometric assessment.
Cattell Culture Fair Intelligence Test (SD = 24)
The Cattell test uses SD=24, meaning its scores are more spread out. An IQ of 148 on the Cattell scale corresponds to the same 98th percentile as IQ 132 on the Wechsler scale. The wider scale can create confusion when comparing scores across tests — always specify the scale when reporting an IQ score.
Stanford-Binet (SD = 15 or 16)
The Stanford-Binet Intelligence Scales (5th Edition) now uses SD=15, the same as Wechsler. Earlier editions (4th Edition) used SD=16. Because standard deviations differ, IQ scores from different Stanford-Binet editions are not directly comparable without conversion.
Common Misconceptions About IQ Scores
IQ scores are widely misunderstood. Here are the most important clarifications:
- IQ is not fixed for life. Flynn Effect research shows average IQ scores have risen ~3 points per decade since the 1930s. Individual IQ can also change due to education, health, nutrition, and developmental factors — especially in childhood. Test-retest reliability is high but not perfect.
- IQ tests measure specific cognitive abilities, not all of intelligence. Standard IQ tests assess working memory, processing speed, verbal comprehension, and fluid reasoning — but do not measure creativity, emotional intelligence, wisdom, social skills, or practical problem-solving ability. Howard Gardner's theory of multiple intelligences highlights dimensions completely outside IQ test scope.
- The online tests are not real IQ tests. Free online "IQ tests" are not standardized, not normed, and not validated against population samples. They typically inflate scores and should not be trusted as legitimate measurements.
- Average IQ is 100 by definition — for the year the test was normed. IQ tests are periodically re-normed against current populations. A score of 130 today means top 2.3% of people alive now — not all humans in history.
- Group differences in average IQ scores do not reflect genetic differences. Research has established that observed group differences (by race, nationality, etc.) are predominantly explained by environmental factors: educational opportunity, socioeconomic status, health, and test familiarity. These are malleable social conditions, not fixed biological endowments.
What IQ Scores Predict (and What They Don't)
IQ scores have genuine predictive validity for certain real-world outcomes, but are often over-interpreted:
What IQ Predicts Well
- Academic performance: IQ correlates ~0.50 with academic grades and ~0.55 with educational attainment (years of schooling). It is one of the strongest predictors of academic success.
- Job performance: Meta-analyses show IQ correlates ~0.35–0.50 with job performance across many occupations. The correlation is strongest in cognitively demanding jobs.
- Learning speed: Higher IQ is associated with faster acquisition of new skills during training programs.
- Income: Modest positive correlation (~0.30) after controlling for other factors.
What IQ Predicts Poorly
- Creativity: Above a threshold (~IQ 120), higher IQ does not predict greater creative achievement.
- Life satisfaction and happiness: Essentially no correlation.
- Emotional intelligence: Orthogonal dimension — high-IQ individuals span the full range of EI.
- Moral character and social responsibility: No meaningful relationship.
Related Calculators
Cognitive performance connects to overall health and wellness. Explore these related tools:
- Age Calculator — age influences cognitive test norms; all major IQ tests use age-based norming tables
- BMI Calculator — research links obesity, sleep apnea, and metabolic syndrome to cognitive performance changes
- Blood Sugar Converter — chronic hyperglycemia is linked to cognitive decline and poorer executive function
- Maintenance Calorie Calculator — adequate nutrition is essential for brain function; undernutrition impacts cognitive development
- Harris-Benedict Calculator — basal metabolic rate reflects the body's energy demands, including brain metabolism (~20% of BMR)
- Ideal Weight Calculator — healthy body weight is associated with better cognitive outcomes across the lifespan
- Period Calculator — hormonal cycles influence cognitive performance and mood in research contexts